


Figure 3.
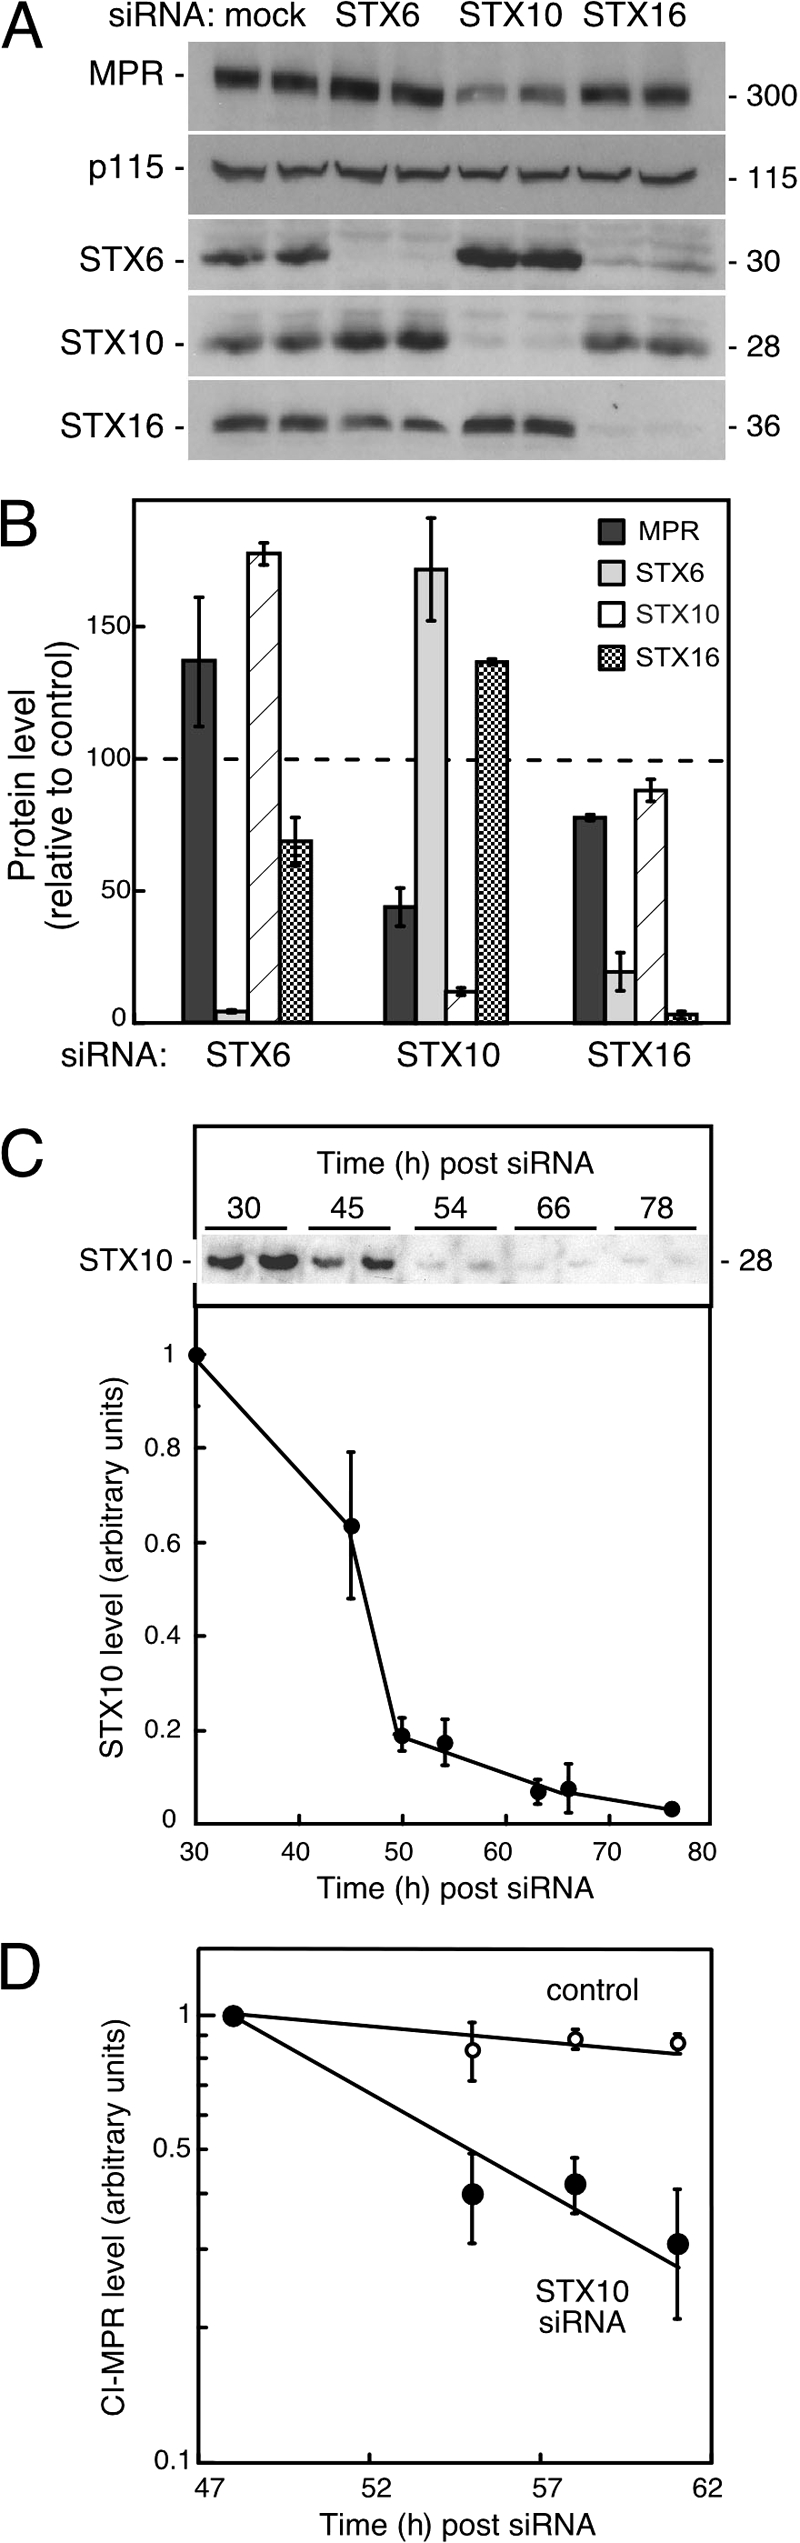
MPRs are destabilized in cells depleted of STX10. CI-MPR and SNARE protein levels in HEK293 cells transfected with the indicated siRNAs. (A) Immunoblot. (B) Quantitation of the data shown in A. Values are from two independent experiments, normalized to p115 levels relative to protein levels in control transfected cells. Error bars represent SD. (C) Kinetics of STX10 depletion after siRNA transfection of HEK293 cells. The inset shows an immunoblot of STX10 monitored at the indicated times. Quantitation of those data is graphed; two independent experiments performed in duplicate are presented. (D) Half-life of CI-MPRs in cells depleted of STX10 measured at the times indicated after siRNA transfection. Numbers at the right in A and C indicate M r in kilodaltons.