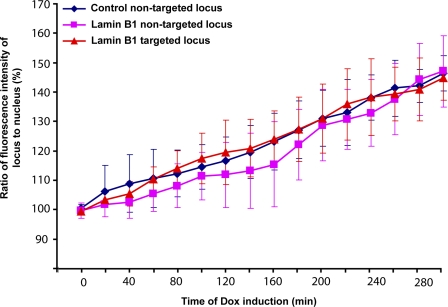
Figure 10.
The kinetics of transcriptional induction of the targeted locus parallels that of the nontargeted locus. Control or targeting cells were transiently transfected with pVitro2–Tet-on + MS2-YFP and induced for 12 h with cumate for targeting fusion expression. The transfected cells (control nontargeted [n = 7], lamin B1–bound nontargeted [n = 8], and lamin B1–targeted [n = 10] cells) were then initially imaged in the mCherry and YFP channels in Dox (−) condition (0 h). Subsequently, imaging was continued in Dox (+) condition every 20 min for a total of 5 h. The ratio of fluorescence intensity of the locus to the entire nucleus (mean values) was expressed as a percentage and plotted against time of Dox induction (each time point is represented by the mean and standard deviation).

