Figure 1.
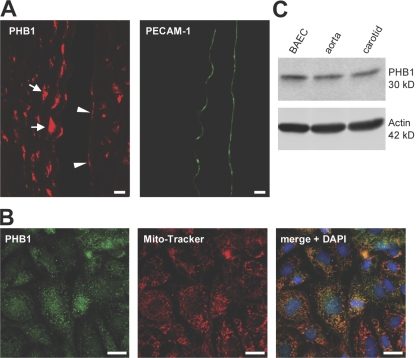
Expression of PHB1 in the vascular system. (A) Mouse aortas were paraffin embedded and sectioned and PHB1 protein expression was analyzed by immunofluorescence (red) microscopy compared with PECAM-1 (as an EC marker, green) with a 20× objective. Arrows and arrowheads depict PHB1 in SMCs and ECs, respectively. Bars, 10 μm. (B) Localization of PHB1 (green) was analyzed in ECs by indirect immunofluorescence compared with MitoTracker (red) and colocalization is shown (orange; blue, DAPI). Bars, 10 μm.(C) Western blot analysis of PHB1 in lysates from BAECs and mouse aorta and carotid arteries.

