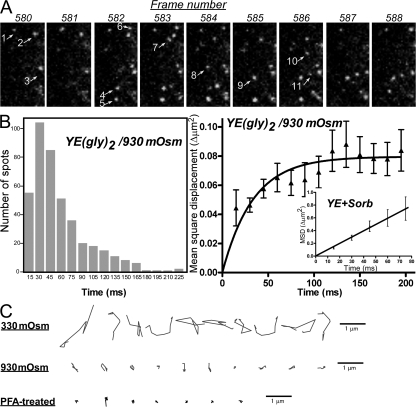
Figure 6.
Transient immobilization of YE(gly)2 by hyperosmolarity. (A) Sequential images of YE(gly)2 in cells exposed to 930 mOsm were recorded (Video 5, available at http://www.jcb.org/cgi/content/full/jcb.200704078/DC1). In a set of nine consecutive images, newly appearing spots are indicated by arrows. (B) Lifetime distribution and MSD plot. Under hyperosmolarity, the MSD for YE(gly)2 reached saturation over time. In contrast, a linear relationship was observed for YE at the same hyperosmolarity (inset). The analysis of three streaming images, including Video 5, is shown. (C) Trajectories of YE(gly)2 under various conditions. X-Y trajectories of a single YE(gly)2 in nine consecutive images are shown. 10 molecules were randomly picked from the videos. The motion is compared with that of formalin-fixed molecules. Error bars represent 95% confidence intervals.

