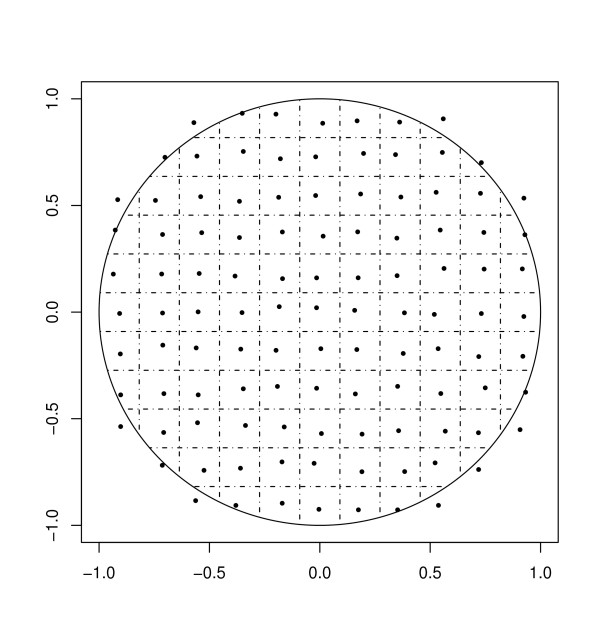
Figure 2.
Illustration of spatial aggregation. One of 12 levels of spatial aggregation used in this study. Grid lines define spatial regions of aggregation, and representative points are chosen randomly within each region. All simulated points are reassigned to the representative point of the appropriate region.

