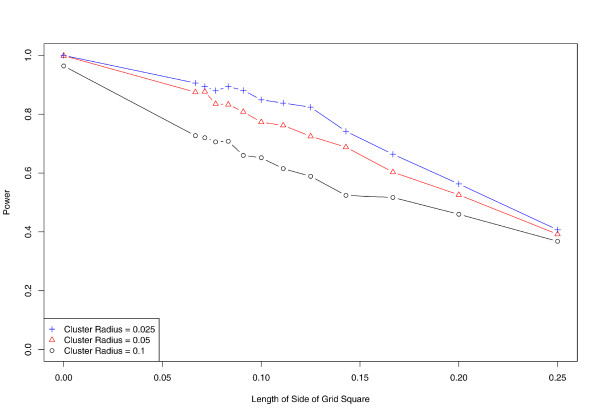
Figure 3.
Effect of aggregation on power. As spatial data are aggregated, power to detect clusters decreases. Horizontal axis denotes level of spatial aggregation, determined by radius of aggregation region; vertical axis denotes proportion of simulated clusters correctly identified at significance level α = 0.05.

