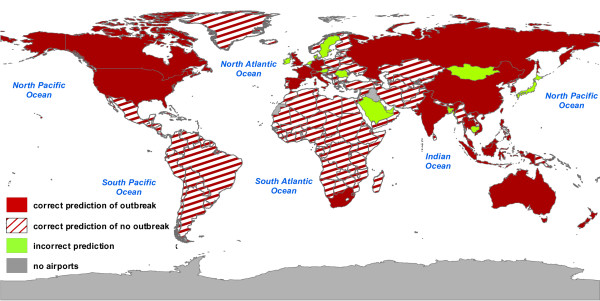
Figure 4.
Map representation of the comparison between numerical results and WHO reported cases. Countries are considered at risk if the probability of reporting an outbreak – computed on n = 103 different realizations of the stochastic noise – is larger than 20%. In red we represent countries for which model forecasts are in agreement with WHO official reports, distinguishing between correct predictions of outbreak (filled red) and correct predictions of no outbreak (striped red). Forecasts that deviate from observed data are represented in green. Results shown refer to the date of 11 July 2003.

