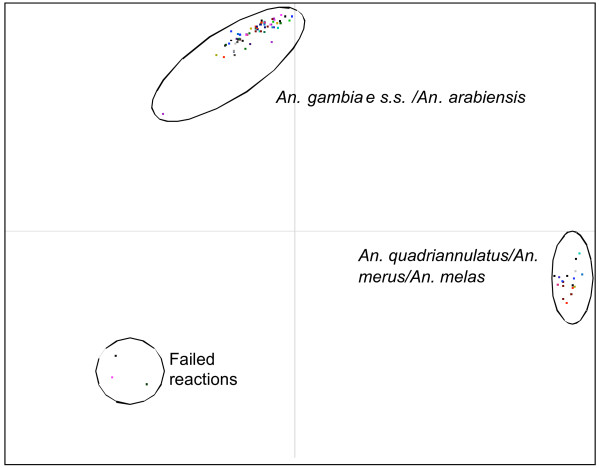
Figure 4.
Scatter plot analysis of TaqMan fluorescence data. In this example real time PCR was carried out using the newly developed TaqMan assay designed to distinguish the principal vector species An. gambiae s.s. and An. arabiensis from the other members of the complex on 96 samples. Fluorescence values of the FAM labelled probe specific for An. gambiae s.s. and An. arabiensis were then plotted against the VIC labelled probe specific for An. quadriannulatus, An. melas and An. merus.

