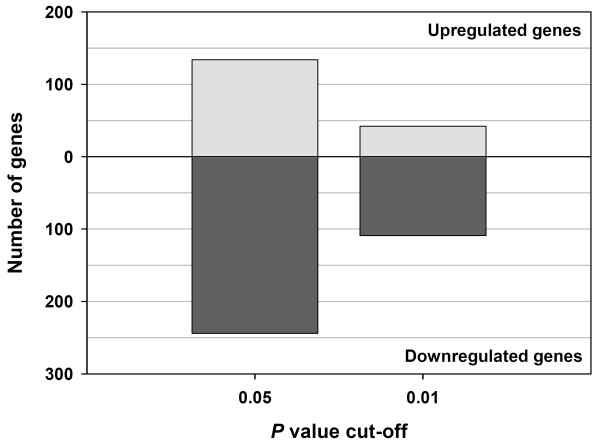
Figure 2.
Differentially expressed genes between BTB-infected and control cattle. Statistically significant differentially expressed gene spot features between PBMC samples from BTB-infected (n = 6) and uninfected control animals (n = 6) in vivo at two different alpha levels (P ≤ 0.05 and P ≤ 0.01). For each P value, the number of genes with increased or decreased expression is shown for the BTB-infected animals relative to the control animals (see Additional files 1 and 2).

