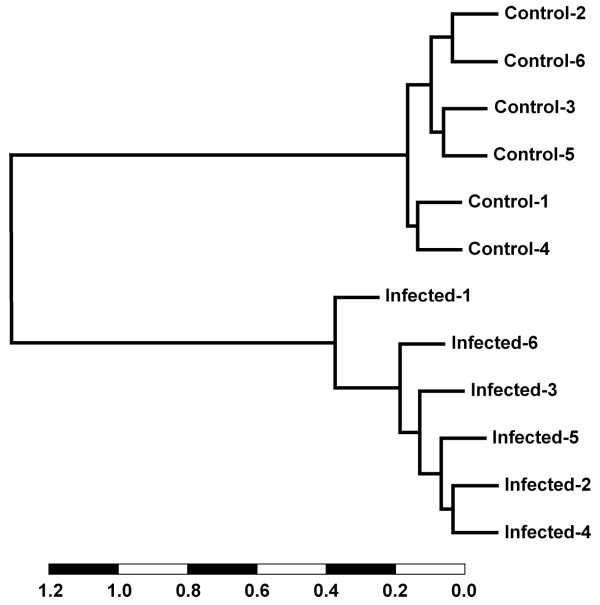
Figure 4.
A gene expression signature of BTB infection. Hierarchical cluster dendrogram constructed with pairwise Pearson correlations from BOTL-5 microarray expression data. Data from 15 genes differentially expressed at the P ≤ 0.001 level were used to construct the dendrogram (scale is expressed as units of the Pearson correlation).

