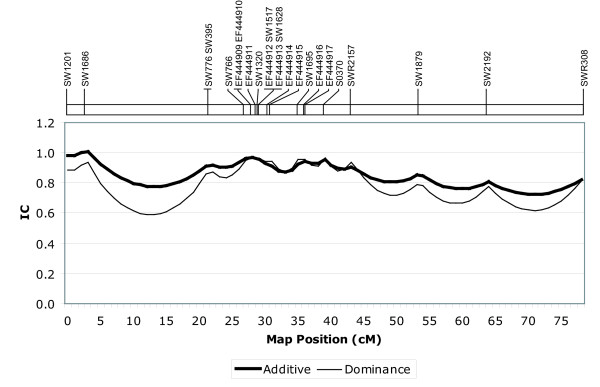
Figure 1.
Additive and dominance information contents calculated every 1 cM. Relative cM position on the SSC2 linkage map is represented on the x-axis. Additive and dominance information contents, calculated according to the method of Knott et al. (1998), are plotted on the y-axis. The relative position of each mapped marker is indicated above the graph.

