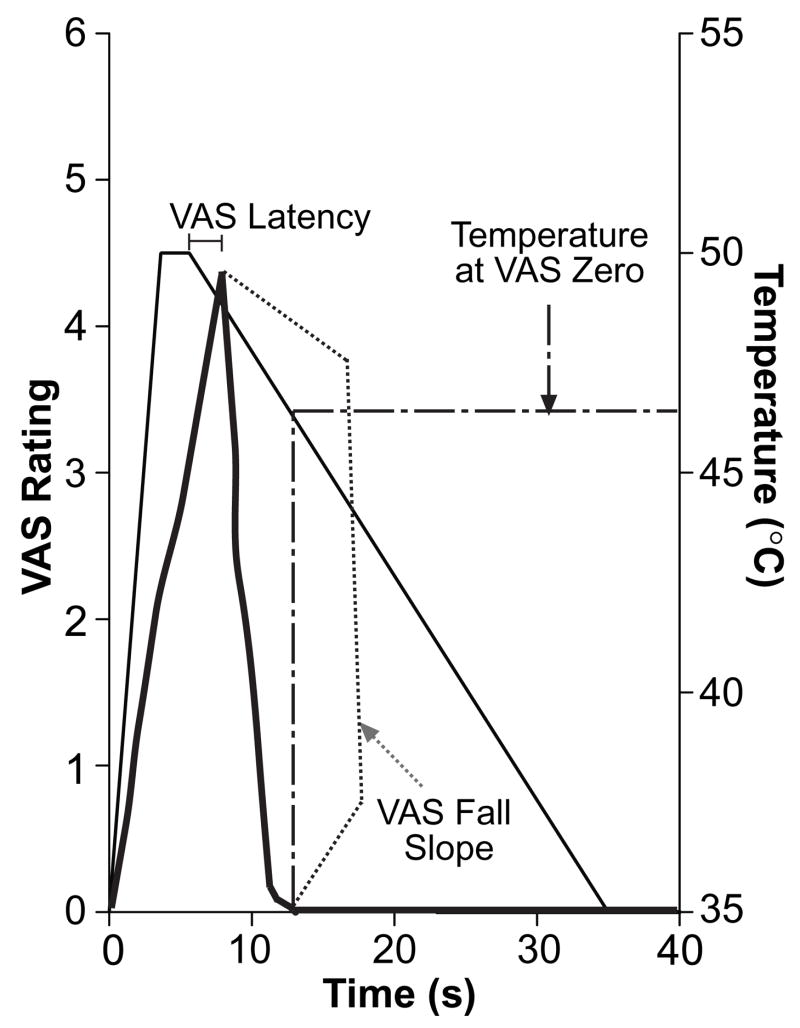
Figure 1. End Points of the One Temperature Paradigm.
Typical VAS ratings of pain (thick, solid line) are superimposed on stimulus temperature (thin, solid line). The VAS fall slope (dotted line) was derived from the VAS ratings alone, while the VAS latency and the temperature at VAS zero (dot-dash line) were calculated using both VAS and stimulus temperature.

