
Fig. 3.
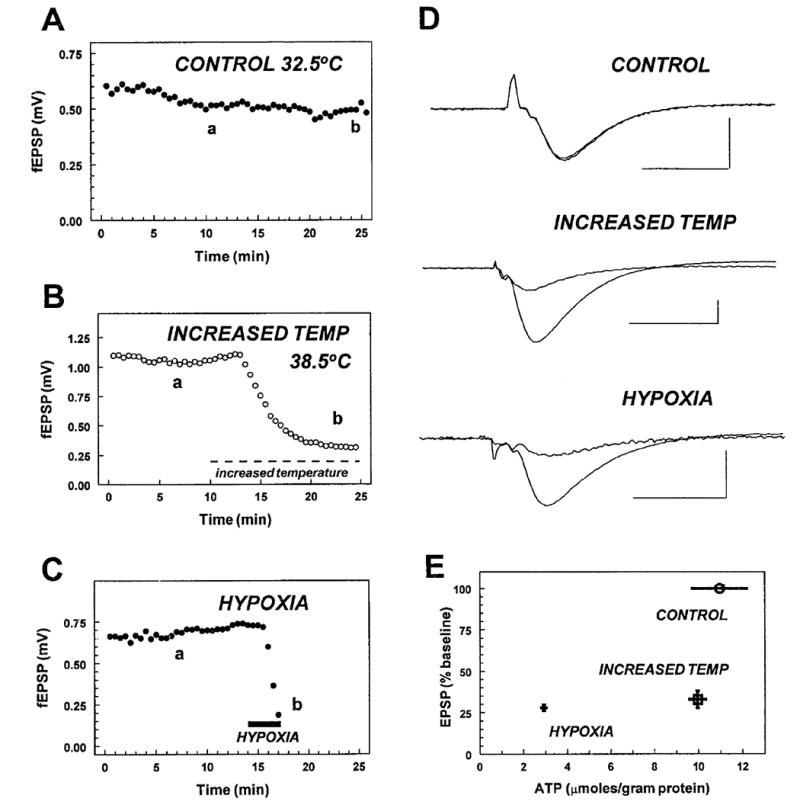
Effect of changes in brain slice temperature and hypoxia on evoked fEPSPs and ATP levels. Slices were either incubated under control conditions (32.5°C, 95% O2) throughout the experiment (A; control), at 32.5°C and then increased to 38.5°C (B; increased temp), or with 95% O2 and then switched to 95% N2 to induce hypoxia (C; hypoxia). Panels A, B, and C show the amplitude of the fEPSP response up until the time when the slices were collected for ATP measurements. D illustrates averaged fEPSP responses during baseline and at the end of the recording under each condition. In all cases (a) indicates the synaptic response sampled during baseline recording and (b) indicates the synaptic response obtained just prior to tissue collection. Scale bars = 10 ms and 0.5 mV. Each record is an average of 4–6 responses, with the exception of the synaptic response during hypoxia where a single response is shown. E illustrates relationship between the fEPSP and ATP levels during control, increased temperature, and hypoxic conditions. The temperature increase and the brief hypoxic episode caused a comparable inhibition of the fEPSP, whereas control responses were stable throughout the experiment. ATP levels measured during the increased temperature were not significantly different from control (9.95 ± 0.85 μmol/g protein, n = 9, vs. 10.9 ± 2.57 μmol/g, n = 5, in controls at 32.5°C; n.s.), but ATP levels measured after hypoxia (2.92 ± 0.84 μmol/g, n = 6) were significantly reduced when compared with both the control and the increased temperature slices (P = 0.006, one-way ANOVA).