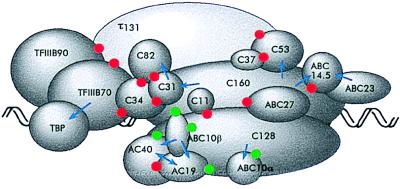
Figure 3.
A model of the pol III transcription initiation complex. Protein–protein contacts observed by using the two-hybrid system are indicated by red dots. Green dots indicate the interaction between AC40, AC19, ABC10α, and ABC10β with A190 and A135 pol I subunits homologous to C160 and C128. Genetic interactions observed by using multicopy suppression experiments of thermosensitive mutations are indicated by arrows. The arrowhead points toward the subunit harboring the mutation that was suppressed. For the sake of simplicity, only the τ131 and τ138 subunits of TFIIIC are represented.

