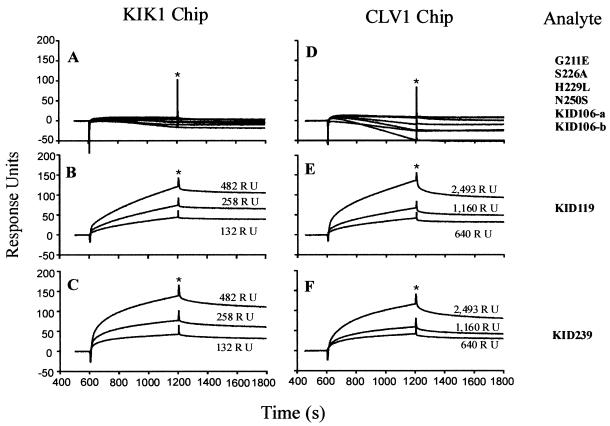
Figure 4.
Representative SPR sensorgrams of the binding between analytes, GST-KAPP mutants, and ligands, MBP-KIK1 and MBP-CLV1, from BIAcore 2000. The sensorgrams shown here represent the binding between two immobilized MBP fusions (KIK1 and CLV1) at three density levels (illustrated as RU above each curve) and various soluble analytes (all at 25 μg/ml). (A–C Left) Binding results on a KIK1 chip. (D–F) Binding results on a CLV1 chip. Right-most column shows the corresponding analytes for each corresponding row. All the analytes (KAPP mutants) incapable of binding with the two ligands are summarized in A and D. The binding results of KID119 (mapped KI domain) and KID239 are shown in B, C, E, and F, respectively. The corresponding ligand densities in A and D are 258 RU and 1160 RU, respectively. The binding signal from the blank surface of chips has been subtracted from the original results. All curves have been adjusted to the same baseline (zero) to make comparison of sensorgrams easier. Phases before asterisks (∗) represent the association sensorgrams; phases after asterisks represent the dissociation sensorgrams.

