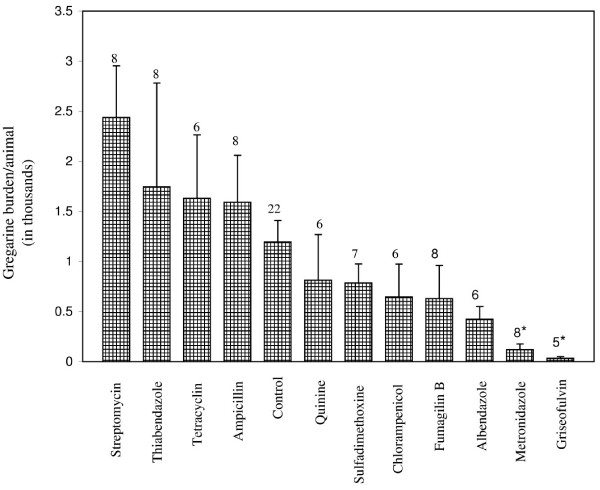
Figure 2.
Mean ± SE number of gregarines in the guts of Romalea microptera grasshoppers (combination of animals dissected on Days 16 and 20) after treatment with different antimicrobials. Numbers above bar represents n. *Means significantly different from control group (ANOVA protected Tukey's HSD test, α = 0.05).

