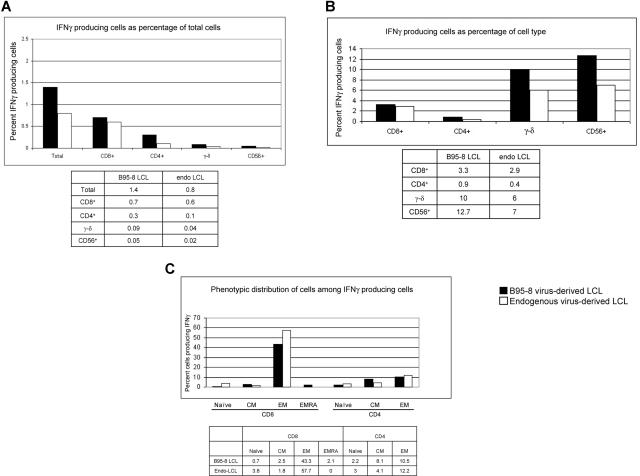
Figure 6.
Comparison of the magnitude of responses and types of cells producing IFNγ following culture of PBMC from healthy EBV-seropositive subject 20 with autologous LCL derived from B95-8 virus or endogenous virus (PBMC/LCL = 10:1). Data indicate percent IFNγ-producing cells as percentage of total PBMC (A) or as percentage of CD8+ T cells, CD4+ T cells, γ-δ+ T cells, and CD56+ (NK) cells (B). (C) Distribution of responding cells by memory phenotype.

