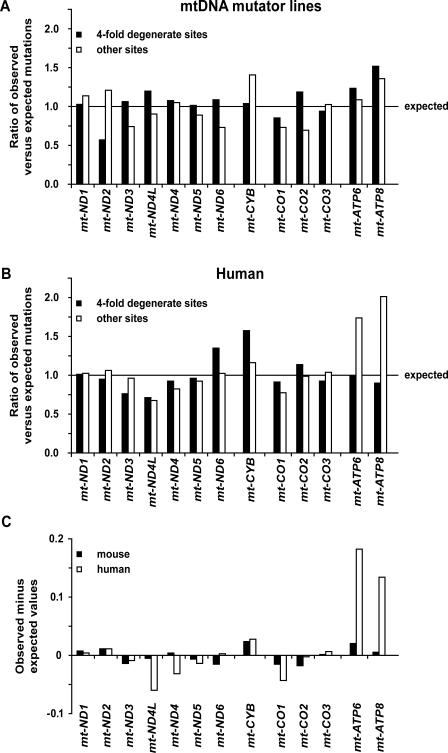
Figure 3. Distribution of Mutations by Gene for mtDNA Mutator Lines and Human mtDNA Sequence Data.
Plot of observed minus expected ratio of 4-fold degenerate sites versus all other protein-coding sites.
(A) For mtDNA mutator mouse lines, the ratio of observed to expected sites is plotted for third codon position mutations at 4-fold degenerate sites (filled bars), and for all other protein-coding gene mutations observed (open bars). The line represents the observed expected values normalized to 1.0.
(B) The same plot for observed human variants found on the mtDB database.
(C) Plot of observed minus expected for non–4-fold degenerate sites for mouse (filled bar) and human (open bars). Genes are grouped by mitochondrial respiratory chain complexes. Expected values are derived from an assumption of equal distribution of the observed mutations in the dataset, and observed values are derived from a count of the detected mutations for that gene (see Material and Methods).

