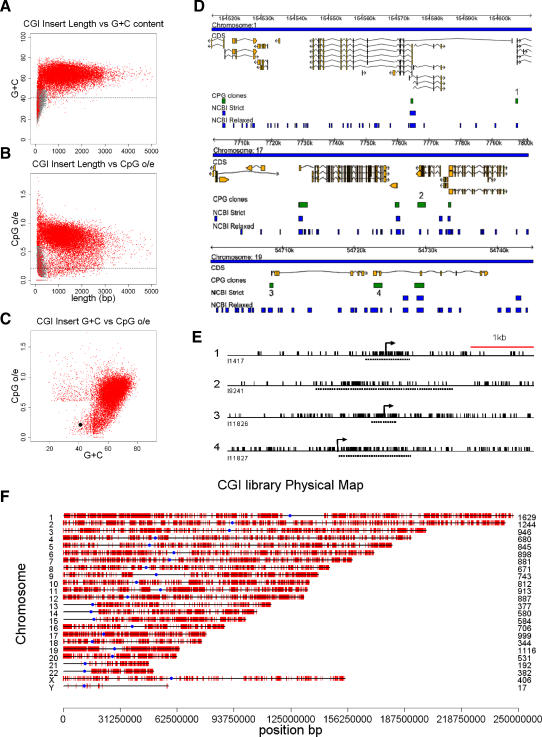
Figure 2. A Library of DNA Sequences that Bind Tightly to the CXXC Column Represents a Comprehensive Set of CGIs.
(A and B) Plots of fragment length versus G+C content (A) and CpG[o/e] (B) for 28,013 unique Mse1 inserts. Fragments shorter than 512 bp with a G+C content = <50% and a CpG[o/e] = <0.6 (grey dots) were filtered out as contamination. The dashed line indicates the base composition (A) and CpG o/e (B) of bulk genomic DNA.
(C) A filtered insert set representing 17,387 CGIs shows a discrete distribution that is distant from bulk genomic DNA (black dot).
(D) Three random chromosomal regions showing CGI sequences mapped by ENSEMBL (green bars). Also shown are CGIs predicted by the NCBI-strict and NCBI-relaxed algorithms (blue bars). The directions of transcription of coding sequences (yellow bars) are arrowed. Numbered CGIs (1–4) represent sequences not detected by the NCBI-strict algorithm.
(E) CpG maps of the four CGI clones not predicted by NCBI-strict. Transcription start sites in examples 1, 3, and 4 are indicated by arrows. Sequenced MseI fragments are denoted by dashed lines and CpG sites by vertical black strokes.
(F) The distribution of cloned CGIs (red strokes) on human chromosomes. The number of CGIs on each chromosome is shown (right) and centromeres are denoted by blue dots.

