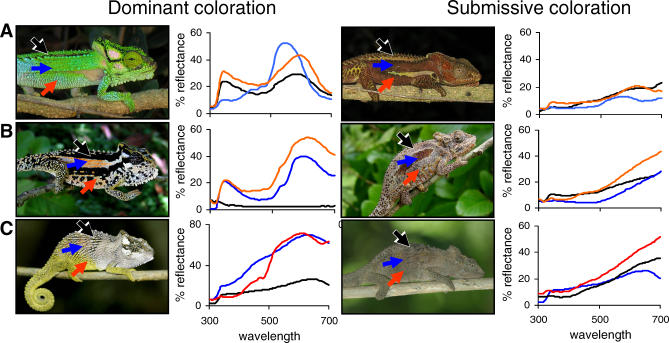
Figure 1. Displays and Reflectance Spectra for Three Species Spanning the Geographic Range of the Genus.
(A) B. damaranum from the south; (B) B. transvaalense from Woodbush in the north, and (C) B. caffrum from the central east. Panels from left to right: male in threat posture showing dominant coloration; associated reflectance spectra; male of the same population showing submissive coloration; associated reflectance spectra. Arrows indicate body regions from which measurements were taken (black = top flank, blue = mid-flank, red = bottom flank).

