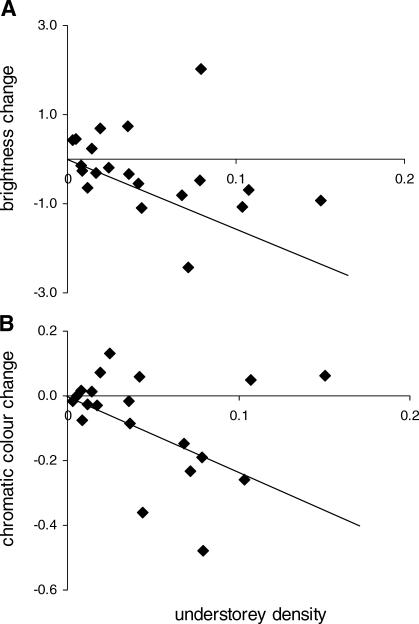
Figure 5. Relationship between Understorey Density and Colour Change.
Understorey density is principal component 2 from the principal components analysis of habitat structure (see Materials and Methods).
(A) Change in brightness (r 2 = 0.14, p = 0.05) and (B) chromatic colour change (r 2 = 0.21, p = 0.02). The regressions are based on Felsenstein's independent contrasts (FIC, positivized on the x-axis), regressed through the origin, with the regression slope indicated by the line. There are N – 1 = 20 independent contrasts.

