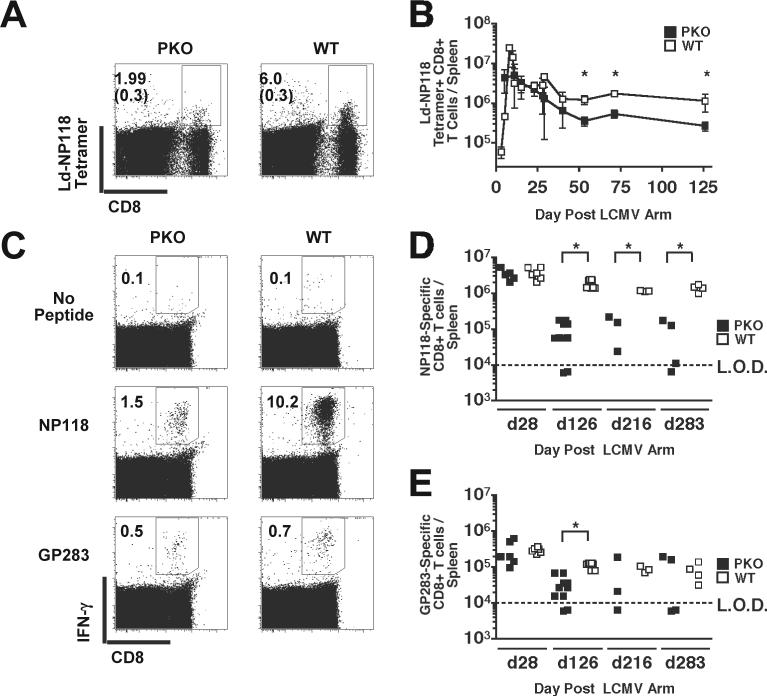
Figure 2.
BALB/c WT and BALB/c PKO mice were infected with 2×10⁵ PFU of LCMV Arm i.p. and analyzed at various days p.i. (A) Detection of NP118−126 –specific CD8+ T cell responses in LCMV-infected mice by H-2Ld-NP118 tetramer staining. Representative dot plots from splenocytes harvested at day 53 p.i. Numbers represent percentages of H-2Ld-NP118 tetramer positive CD8+ T cells; background staining in uninfected PKO and WT control mice are in parenthesis. (B) Mean total number +/− SD of H-2Ld-NP118-specific CD8+ cells/spleen, from >3 mice/group, at the indicated day p.i. Data was pooled from 8 individual experiments. * p ≤ 0.05. (C) Functional assessment of virus-specific CD8+ T cell responses in LCMV-infected mice. CD8+ T cell responses to the dominant NP118−126 and the subdominant GP283−291 peptides were analyzed by peptide-stimulated ICS at various times p.i. Representative dot plots from unstimulated and peptide-stimulated splenocytes harvested at day 120 p.i. Total number of (D) NP118−126 –specific and (E) GP283−291 –specific CD8+ T cells/spleen at the indicated day p.i. Each symbol represents an individual mouse (n = 3−10 mice / time point). Data was pooled from 2 individual experiments. Dashed line indicates the LOD. * p ≤ 0.05.

