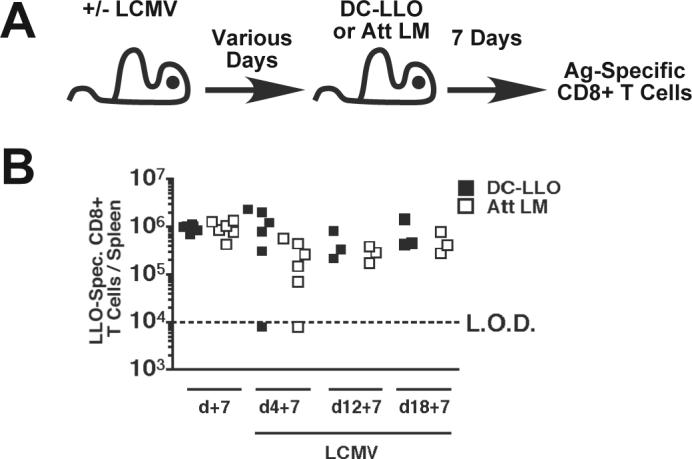
Figure 4.

CD8+ T cell responses to peptide-coated dendritic cells and Att LM infection in LCMV-infected mice. (A) Experimental design. BALB/c PKO and BALB/c WT mice were infected with 2×10⁵ PFU of LCMV Arm i.p. At days 7, 12, or 18 post LCMV infection these mice and LCMV-naïve control mice were injected with 3×10⁶ CFU Att LM or LLO91−99 – coated dendritic cells (DC-LLO). CD8+ T cell responses to LLO91−99 and NP118−126 were analyzed by ICS 7 days later. (B) Total number of LLO91−99 –specific CD8+ T cells/spleen at the indicated time point. Each symbol represents an individual mouse (n = 3−6 mice / time point). Data was pooled from 2 individual experiments. Dashed line indicates the LOD.
