Figure 7.
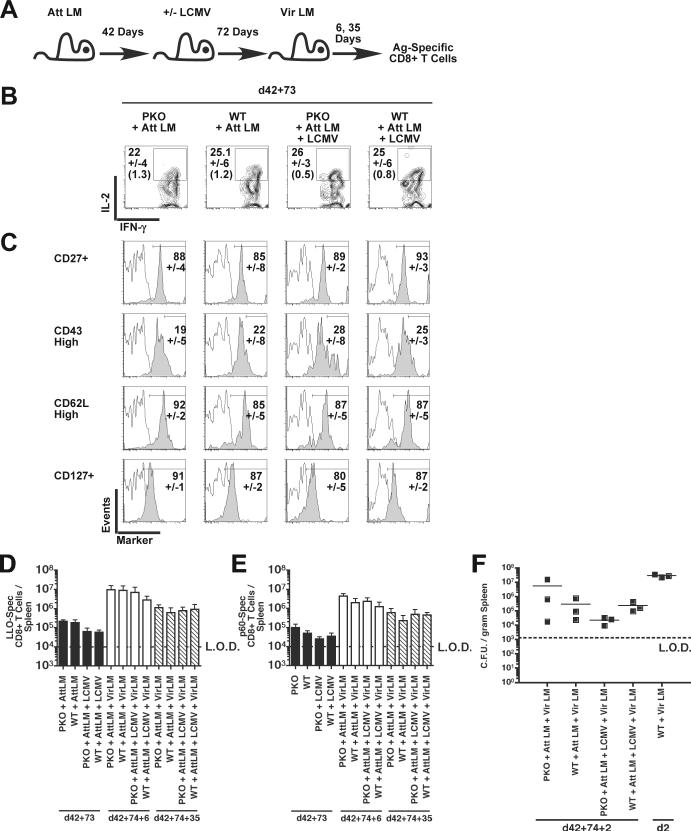
Phenotype and function of pre-existing LLO91−99 –specific memory CD8+ T cell in LCMV-infected mice. (A) Experimental design. BALB/c PKO and BALB/c WT mice were vaccinated with 3×10⁶ CFU of Att LM and infected with 2×10⁵ PFU of LCMV Arm i.p. 42 days later. LLO91−99 –specific memory CD8+ T cell were analyzed at day 73 post LCMV Arm infection for IFN-γ expression by ICS in combination with staining for IL-2, CD27, the activation-associated glycoform of CD43, CD62L, and CD127. (B) Representative contour plots of IFN-γ+ CD8+ T cells analyzed for IL-2 production. Numbers represent the mean percentage +/− SD of IL-2 producing IFN-γ+ CD8+ T cells or (isotype control). (C) Representative histograms of IFN-γ+ CD8+ T cells analyzed for expression of each phenotypic marker (solid histograms) or isotype control (open histograms). Numbers represent the mean percentage +/-SD of IFN-γ+ CD8+ T cells staining positive for each phenotypic marker. CD8+ T cell responses were determined at day 6 and 35 post secondary challenge by ICS. Mean, +/− SD, total number of (D) LLO91−99 –specific and (E) p60217−225 –specific CD8+ T cells/spleen in mice 1 day prior to Vir LM challenge (solid bars), at day 6 p.i. (open bars), and at day 35 p.i. (diagonally striped bars). Data is representative of duplicate experiments. n = 3 mice / time group. Dashed line indicates the limit of detection (LOD). (F) The mean number of bacteria per spleen was determined 2 days after Vir LM infection. Each symbol represents an individual mouse. Solid lines indicate the mean CFU/gram spleen (n = 3 mice / group). Dashed line indicates the limit of detection (LOD).

