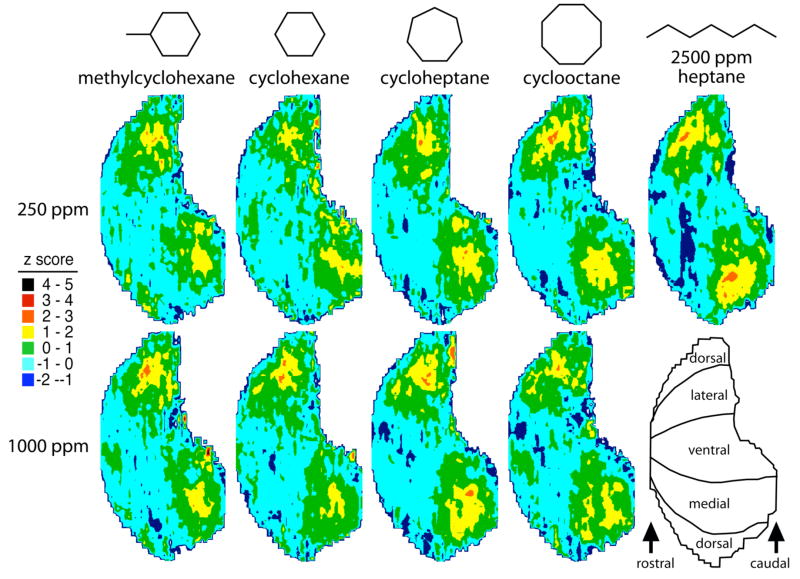
Fig. 1.
Anatomically standardized contour charts showing relative 2-DG uptake across the glomerular layer in response to a series of cyclic hydrocarbon odorants at two concentrations. Also included is a previously published chart (Ho et al., 2006a) showing uptake evoked by the straight-chained hydrocarbon odorant heptane, which activated similar parts of the bulb. Charts are oriented as shown at bottom right. Charts represent z-score standardized data matrices averaged across different rats exposed to the same odorant condition.

