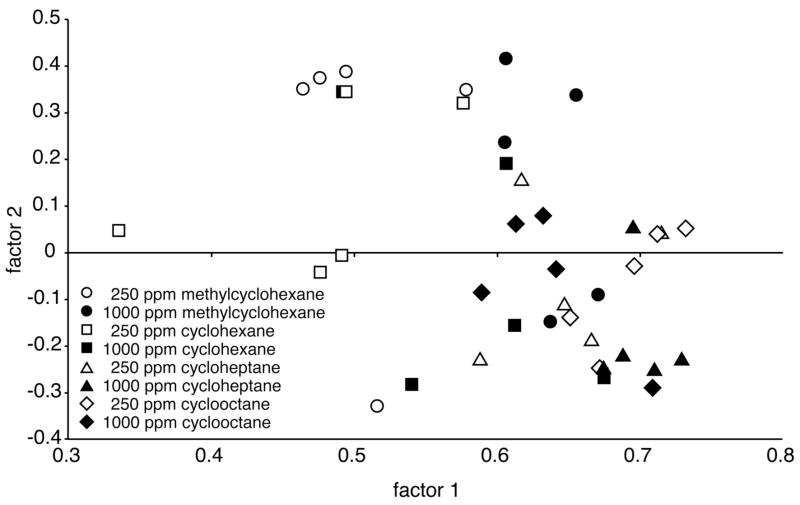
Fig. 2.
Scatter plot of the first two factors extracted by principal components analysis of the individual activity patterns involved in the cyclic hydrocarbons experiment. Individual uptake matrices standardized using z scores were subjected to pair-wise Pearson correlation analysis, and the resulting matrix of correlation coefficients was used as input data for a principal components analysis. Each point in the scatter plot represents an individual animal’s pattern of 2-DG uptake. Relative clustering of points indicates overall similarity of pattern. Subsequent analyses revealed that both factors contained significant information regarding odorant identity, and that the first factor also contained information regarding odorant concentration.

