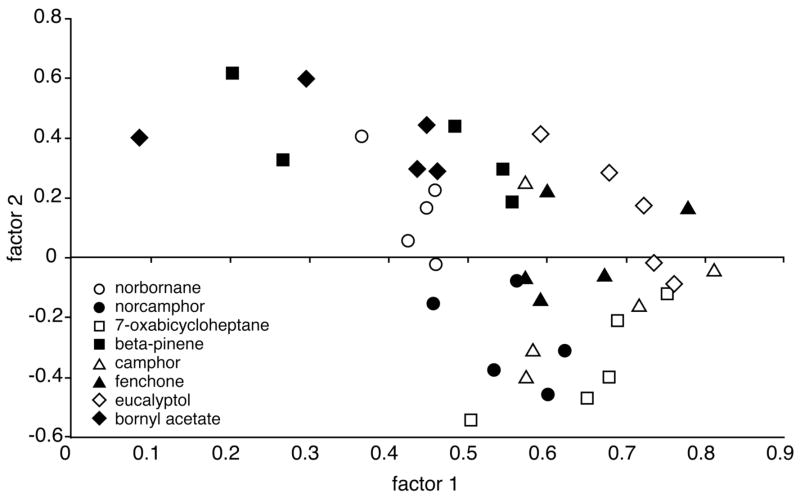
Fig. 5.
Scatter plot of the first two factors extracted by principal components analysis of the individual activity patterns involved in the bicyclic odorants experiment (Fig. 3A). Individual z-score matrices were subjected to pair-wise Pearson correlation analysis, and the matrix of correlation coefficients served as input data for principal components analysis. Each point represents an individual animal’s pattern of 2-DG uptake. Subsequent statistical analyses revealed that both factors contained highly significant information regarding odorant identity.

