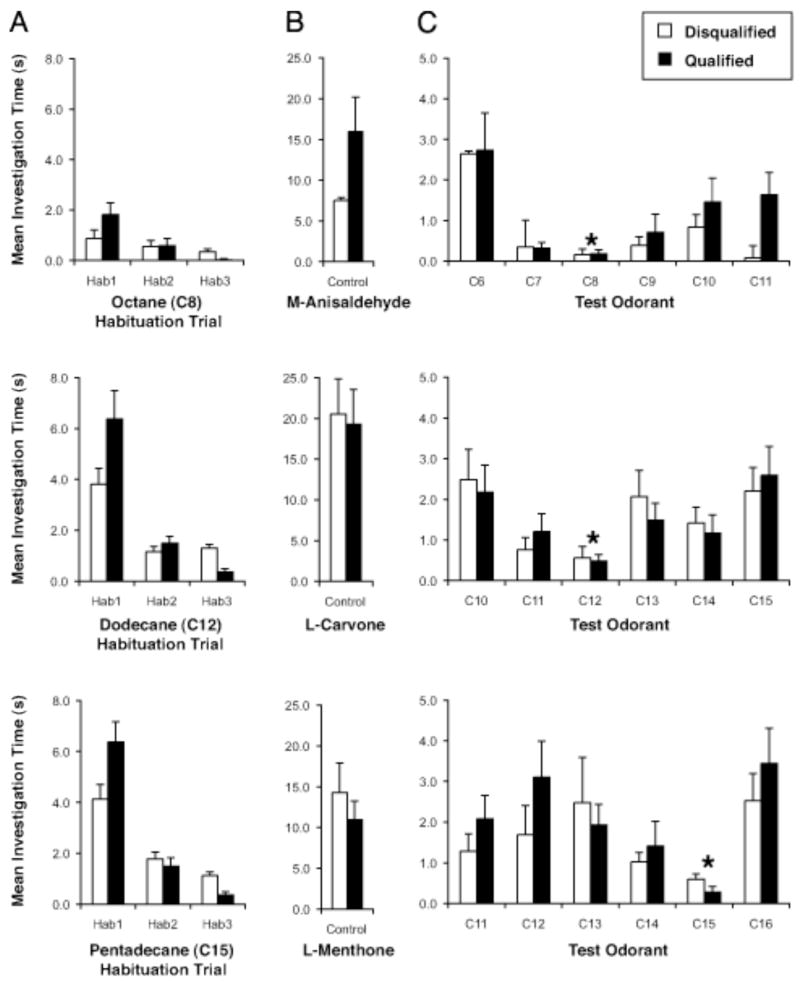
Figure 7.

Behavioral results from animals that satisfied the criteria to be included for statistical analysis (black bar) and those that were excluded (white bar). A: The three habituation trials revealed major differences in behavior between these two groups of animals. B: Both groups of animals responded to the control odorant, which is consistent with the fact that few animals were disqualified in this study for the lack of investigation during this control trial. C: Similar behavior exhibited by both groups of animals during the test trials. For each experimental series, the alkane that was used as the habituated odorant was marked with an asterisk. Standard errors were shown in all panels.
