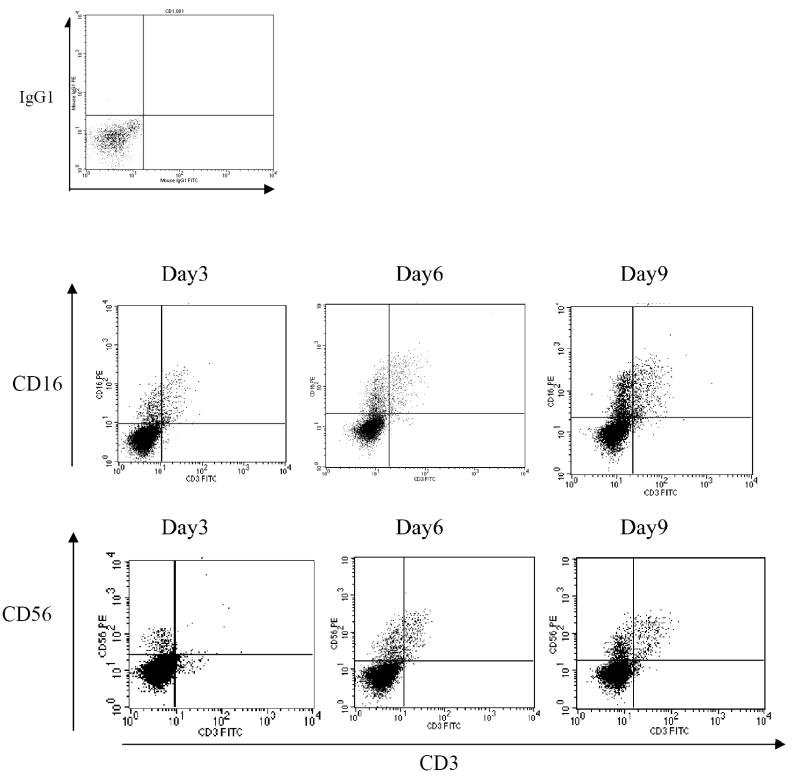
Figure 2.
Flow cytometric plots of cultured cells in NK inductive medium with time in culture. The dot plot on the top left represents the isotype control; the top 3 plots show the expression of CD16 and CD3; the bottom 3 plots display the expression of CD56 and CD3. These plots show day 3, 6, and 9 in culture.

