
Figure 2.
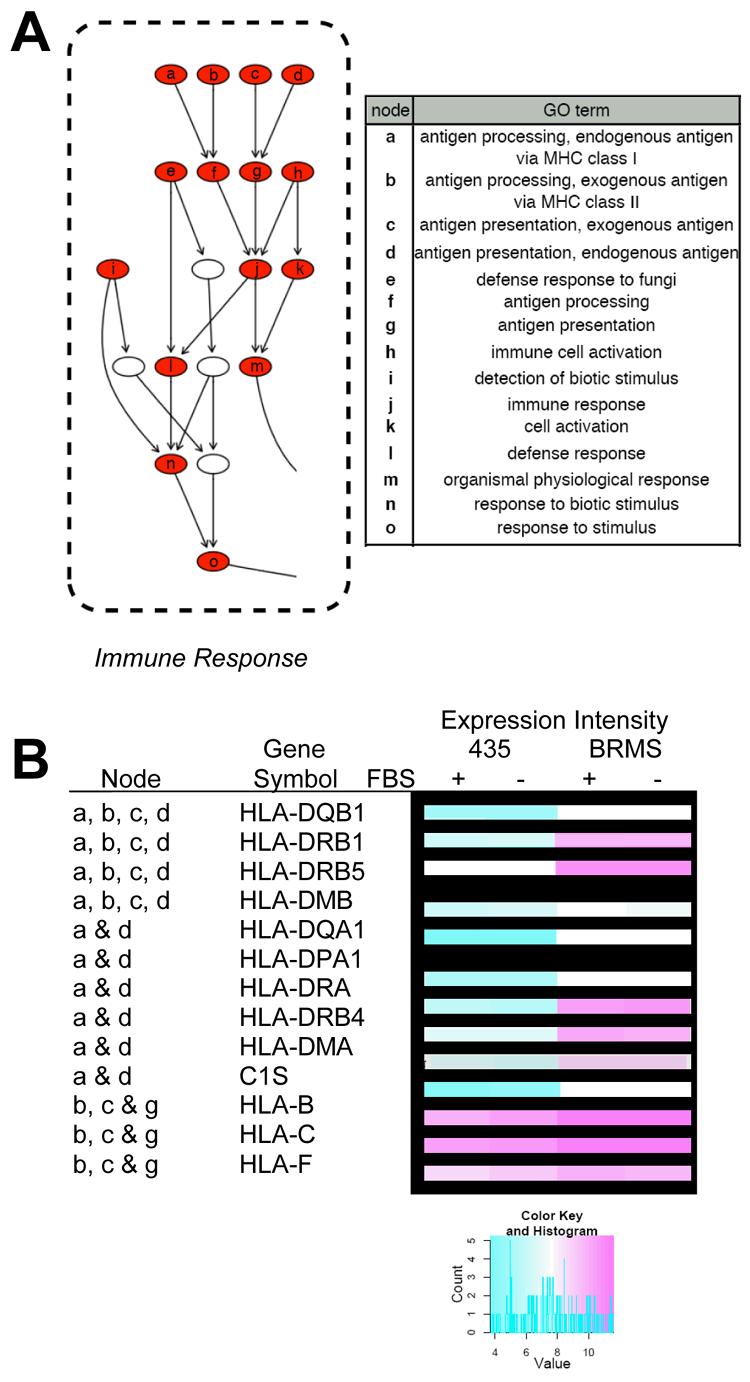
Immune response-associated Gene Ontology (GO) terms and related genes from the data set. A) GO terms are presented from the directed acyclic graph (DAG) of biological process (BP) GO terms which met the cut-off criteria (see materials and methods) with table identifying over-represented BP GO terms. Red nodes indicate BP GO terms which were generally induced in 435/BRMS1 cells relative to 435 cells. Nodes represent general ancestor BP GO terms at the bottom of the graph proceeding upward to more specific child BP GO terms. B) Several genes identified in some of the represented BP GO terms and their expression (as represented in a heat map), are shown in the table.