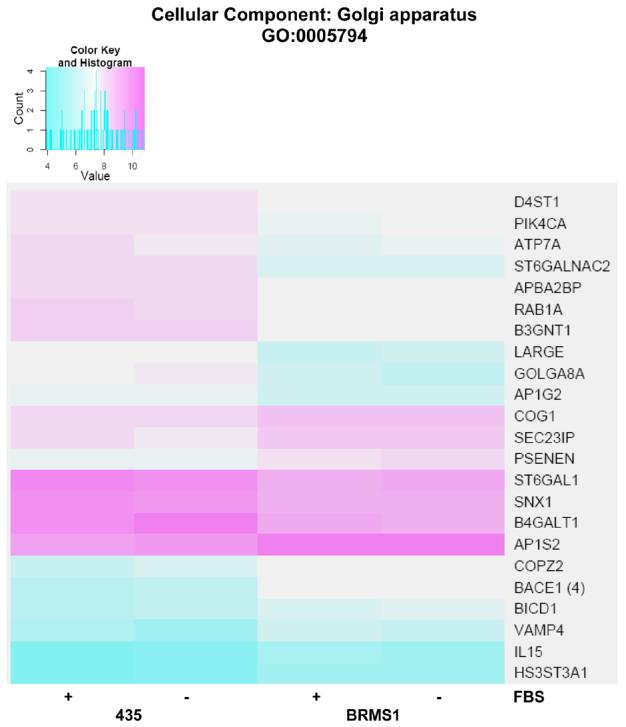
Figure 4.

Heat map of significant genes within the cellular component (CC) Gene Ontology (GO) term Golgi apparatus. Color key is shown at top left and represents the log(2) expression intensity for the average of the probe sets for the specified gene determined to be significantly altered in our data. Cyan color indicates lower relative expression and magenta indicates higher relative expression. If more than one probe set for a given gene was determined to be significant, they were averaged together prior to heat mapping and the number of probe sets is indicated in parentheses to the right of the gene symbol on the map. The presence or absence of fetal bovine serum (FBS) in the samples from each cell line is indicated at the bottom of the map.
