
Fig. 5.
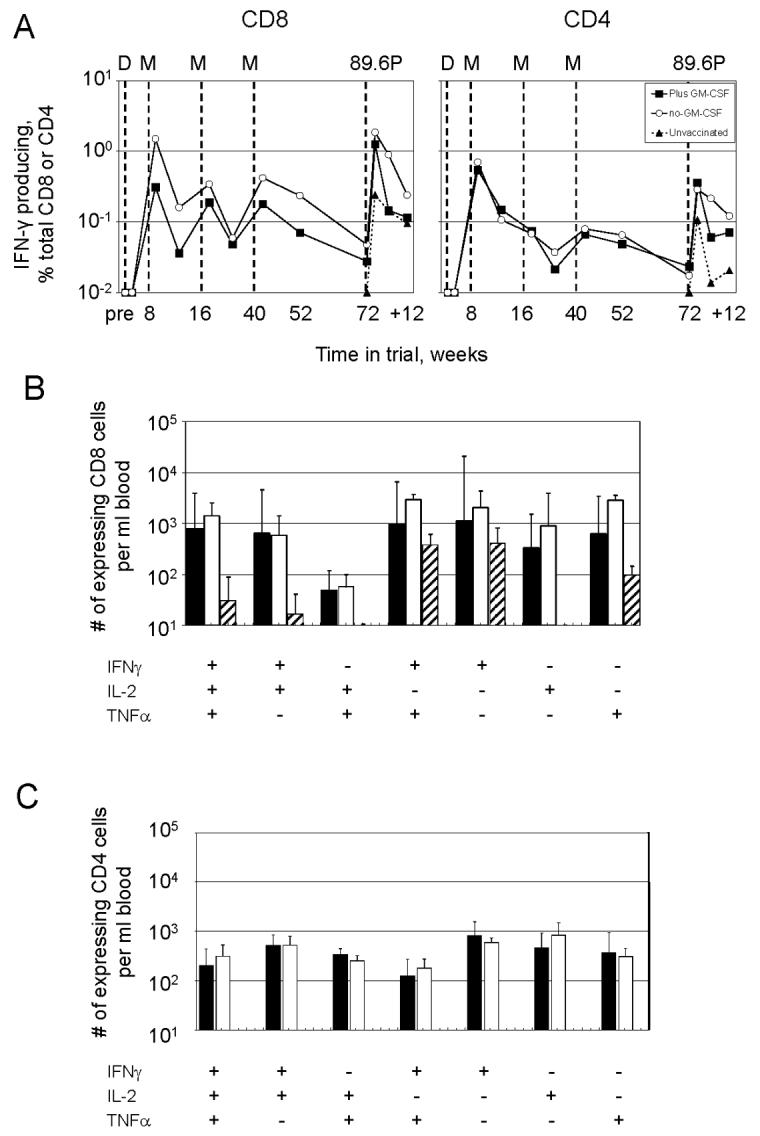
Analyses for responding T cells using ICS assays. (A) Temporal CD8 and CD4 T cell measured as IFN-γ producing cells as a % of total CD8 or CD4 T cells. The times of immunization and challenge are indicated by vertical dotted lines (see legend to Fig. 3 for detail). Pre, samples taken prior to immunization but plotted at the time of the 1st immunization. Weeks indicated with a “+” are weeks post challenge. (B) and (C) Characterization of cytokine co-production profiles at 3 weeks post challenge for CD8 T cells and CD4 T cells for the different trial groups. Data are expressed as number of expressing cells per ml of blood. Filled bar, plus GM-CSF group; open bar, minus GM-CSF group; and hatched bar, unvaccinated controls. Sufficient CD4 T cells were not present in the unvaccinated controls for analyses.