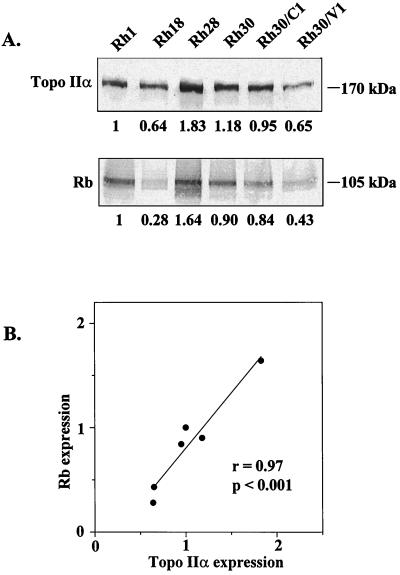
Figure 1.
Constitutive expression of topo IIα and Rb proteins in RMS cell lines. (A) Representative immunoblots based on analysis of total cell extracts with specific antibodies (Ab-284, topo IIα; G3–245, Rb). Equal loading of the proteins was confirmed by Ponceau-S staining (Materials and Methods). Values beneath the lanes are mean levels of topo IIα or Rb expression (relative to the levels in Rh1 cells) from five separate experiments. SDs ranged from 0.08 to 0.47. (B) Correlation of topo IIα expression with Rb expression in RMS cell lines. r = Pearson’s correlation coefficient; the P value was determined by Student’s t test.

