
Figure 6.
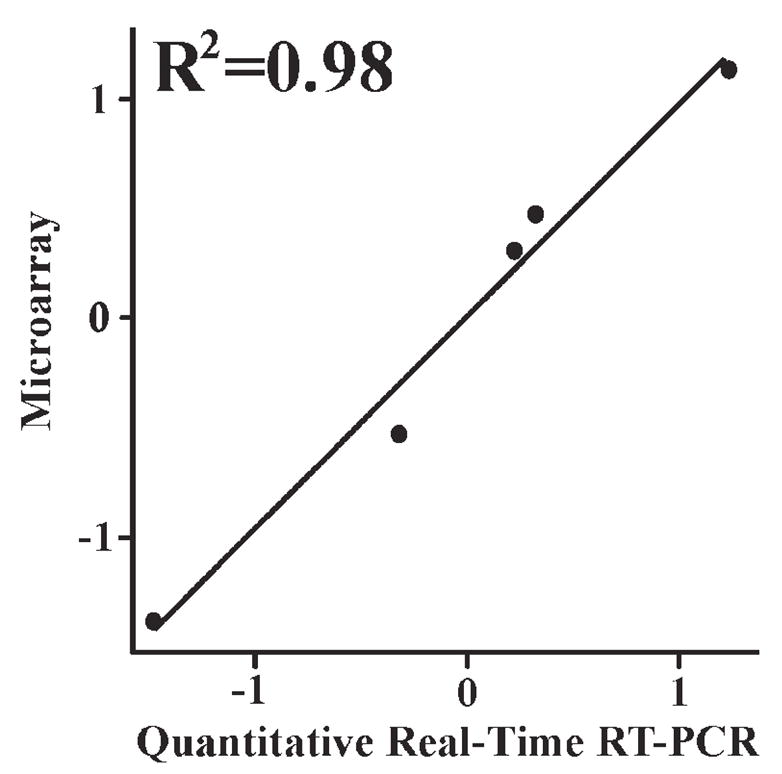
Scatter plot demonstrating the correlation between MBP microarray and quantitative RT-PCR data. Difference scores for each Study II subject pair were converted to Z-scores and correlated by Pearson’s product moment.
Official websites use .gov
A
.gov website belongs to an official
government organization in the United States.
Secure .gov websites use HTTPS
A lock (
) or https:// means you've safely
connected to the .gov website. Share sensitive
information only on official, secure websites.
Scatter plot demonstrating the correlation between MBP microarray and quantitative RT-PCR data. Difference scores for each Study II subject pair were converted to Z-scores and correlated by Pearson’s product moment.