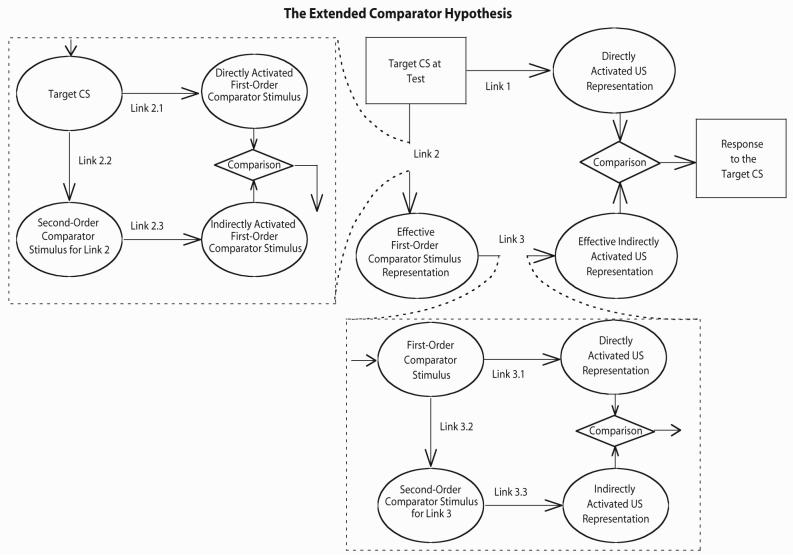
Figure 3.
The extended comparator hypothesis (Denniston, Savastano, & Miller, 2001). Ovals represent stimulus representations and rectangles represent the physical stimulus and response. Conditioned responding to the target CS is determined by a comparison between the directly and the indirectly activated US representations at the time of testing: The conditioned responding is positively correlated with the magnitude of the directly activated US representation (Link 1) and negatively correlated with the magnitude of the indirectly activated US representation (the product of Links 2 and 3). In the original comparator hypothesis (Miller & Matzel, 1988, see upper right part of figure excluding the dashed boxes), responding to the target CS is down-modulated only by the absolute strengths of Links 2 and 3, whereas in the extended comparator hypothesis the effectiveness of each of these two comparator links is influenced by its own comparator processes. CS, conditioned stimulus; US, unconditioned stimulus.

