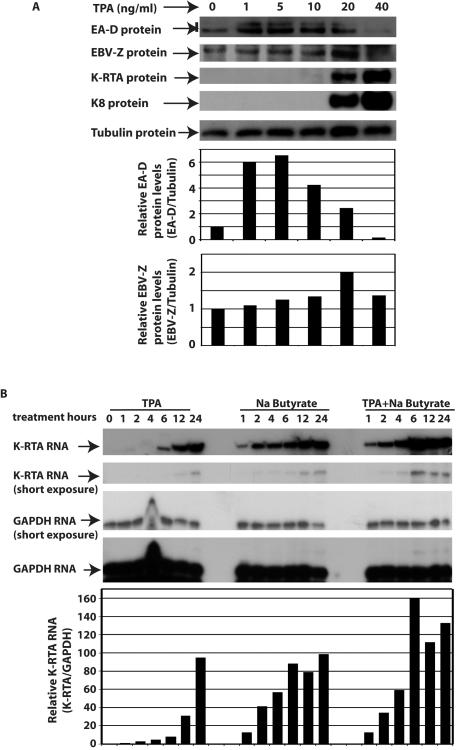
Figure 6. Initiation of KSHV lytic gene expression correlated with the reduction of EBV lytic gene expression.
A. TPA induces either EBV or KSHV lytic replication. BC1 (EBV+/KSHV+) cells were treated with TPA at indicated dosages shown on the top. Cell lysates were used for western blot analyses a day later. The same membrane was stripped and reprobed with other antibodies. The identity of proteins is as shown. The relative levels of EA-D expression (EA-D/Tubulin) and EBV-Z (EBV-Z/Tubulin) were obtained by measuring intensity of EA-D, EBV-Z, and Tubulin using ImageJ 1.37v software (NIH), and are shown on the bottom panels. One representative from three independent experiments is shown. B. Kinetics of K-RTA expression in BC1 cells. BC1 cells were treated with TPA (20 ng/ml), or butyrate (3 mM), or both. Total RNA were isolated at indicated time post treatment. The expression of K-RTA and GAPDH RNA was monitored by RPA with K-RTA and GADPH probes simultaneously. Specific protections of K-RTA and GAPDH RNAs are indicated. The relative levels of K-RTA RNA expression (K-RTA/GAPDH) were obtained by measuring intensity of K-RTA and GAPDH using ImageJ 1.37v software (NIH), and are shown on the bottom. One representative from three independent experiments is shown.

