
Figure 3.
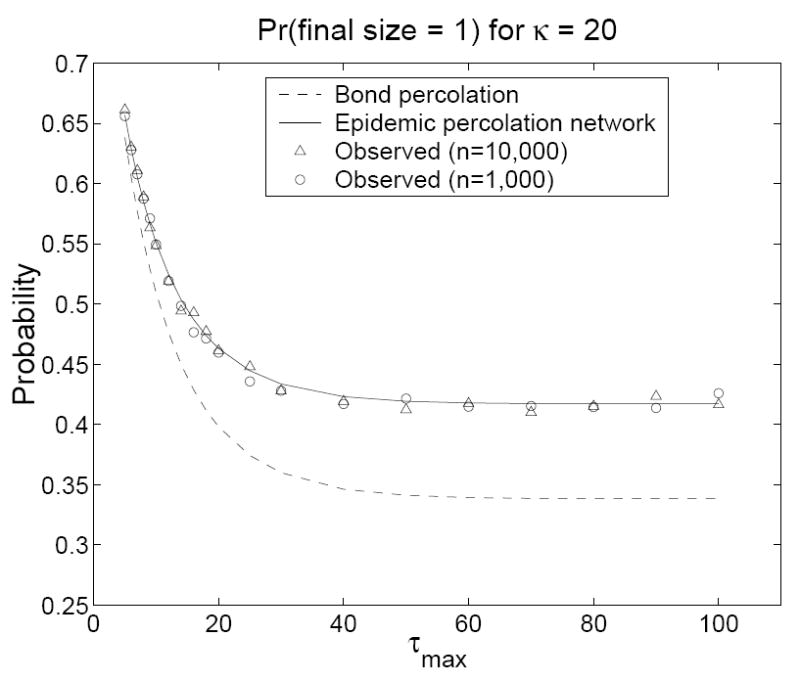
The predicted and observed probabilities of an outbreak of size one on a contact network with κ = 20 as a function of τmax. Models were run for τmax = 5, 6, 7, 8, 9, 10, 12, 14, 16, 18, 20, 25, 30, 40, 50, 60, 70, 80, 90, and 100. Each observed value is based on 10, 000 simulations in a population of size n. For n = 10, 000, 1000 simulations were conducted on each of ten contact networks. For n = 1000, 100 simulations were conducted on each of 100 contact networks.