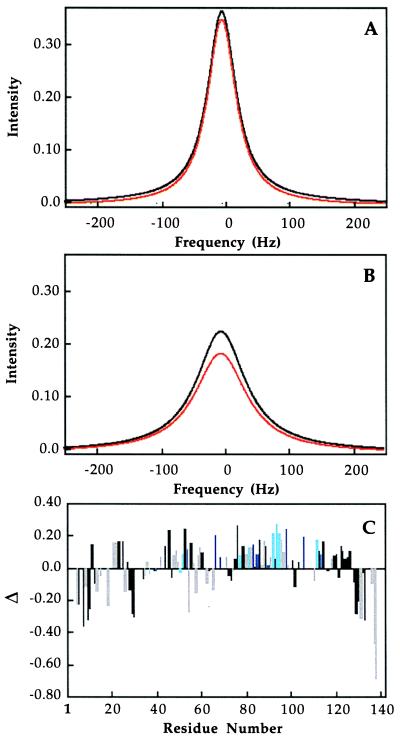
Figure 1.
Line shape simulations of MMOB titrations with MMOH by using Eq. 5 and koff values of 3.2 s−1 (A) or 25.6 s−1 (B) for chemical shift differences of 0 Hz (black) and 500 Hz (red). R1, R2, and a are 23 Hz, 250 Hz, and 0.8, respectively. In C is presented a comparison of observed peak height differences from [15N,1H]-HSQC spectra of MMOB in the absence of hydroxylase and at a 10 MMOB to 1 MMOH ratio. Differences are normalized according to Eq. 6, and the homology conservation color scheme of Fig. 3 is used to highlight the correlation between sequence conservation and binding data.

