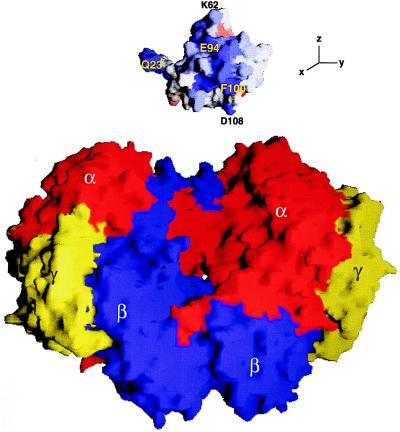
Figure 5.
A surface diagram model for docking MMOB (top) into the canyon of MMOH (bottom). Each subunit of MMOH is distinguished by color, whereas MMOB is colored according to our binding data. Residues of MMOB most affected by binding are colored blue and those least affected are red. For clarity, MMOB has been translated away from its proposed docking site on the surface of the hydroxylase and rotated clockwise about the y-axis by 90° to expose residues most involved in binding. This figure was produced by using grasp (29).

