
Figure 2.
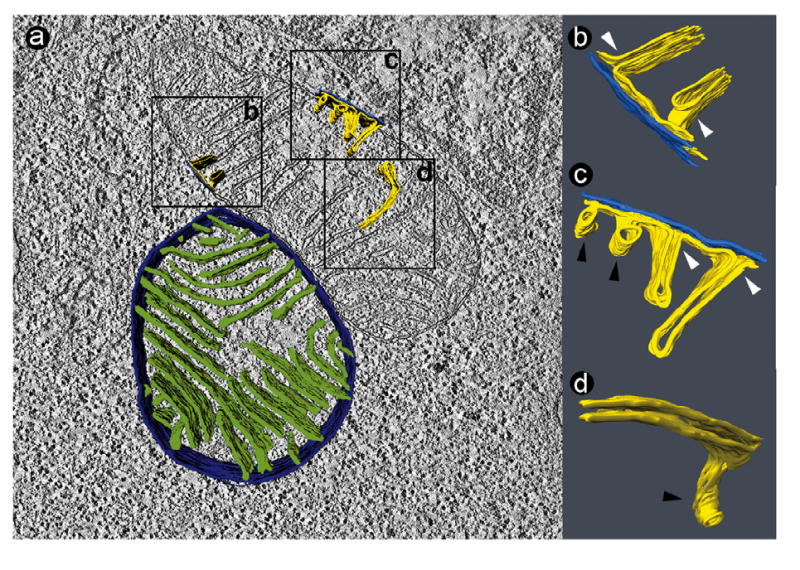
Tomogram of two normal lymphoblast mitochondria (50 nm section). a: Slice of the tomogram with surface-rendered depiction of a 3-D model, showing the peripheral compartment (outer membrane + intermembrane space + inner boundary membrane) in dark blue and the cristae in green. The boxes (0.4 μm × 0.4 μm) mark three segmented details, in which the outer membrane is shown in bright blue and the inner membrane in yellow. b, c, d: 3-D models of membranes in the corresponding boxes. The images were magnified and rotated to reveal details of interest. White arrowheads point to junctions between lamellar cristae and the inner boundary membrane. Black arrowheads point to tubular cristae.