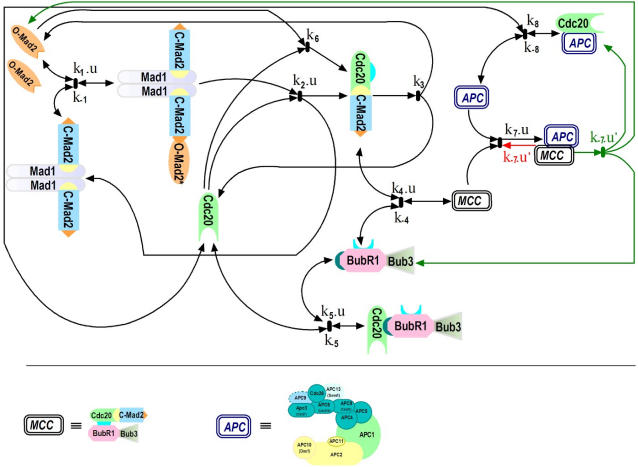
Figure 1. Schematic network of the MSAC model.
The arrows describe the interactions between the proteins and complexes. Red lines represent the Dissociation variant, green lines represents the Convey variant, while the black arrows are common to both. The switching parameter u models the effect of the attachment. We set u = 1 for the unattached case and u = 0 for the attached case. We set u′ = 1 for the uncontrolled scenario and u′ = 1−u for the controlled scenario (Table 1). The model incorporates three central control mechanisms, namely Mad1/Mad2 induced Cdc20 sequestering based on the Template Model, MCC formation, and APC inhibition. These sub-systems can be red from left to right. Nine biochemical reaction equations describe the interactions of 11 species: Mad1:C-Mad2, O-Mad2, Mad1:C-Mad2:O-Mad2*, Cdc20, Cdc20:C-Mad2, Bub3:BubR1, MCC, Bub3:BubR1:Cdc20, APC, MCC:APC, and APC:Cdc20. Below the network, the subunits of MCC as well as APC are depicted.

