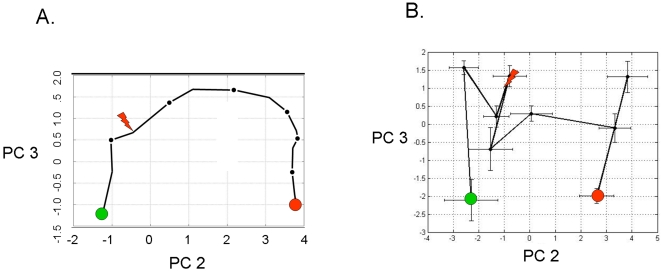
Figure 2.
(A) Principal components analysis of the leukocyte average relative RNA abundance of the 109 human orthologs to the 219 murine genes identified in Supplemental Table S1, plotted for all eleven patients who developed VAP. The translation along principal component (PC) 2 appears to be associated with the development and recovery from pneumonia. The red arrow indicates the day where the attending physician diagnosed VAP. The green circle indicates the point at which the patient entered the study; the red circle is the point at which the patient exited the study. (B) Principal components analysis of the average absolute abundance of plasma cytokines and soluble receptors during the study period across all eleven VAP patients. Individual cytokines do not have significant changes in abundance during the time course of disease (P > 0.05 for all individual proteins).

