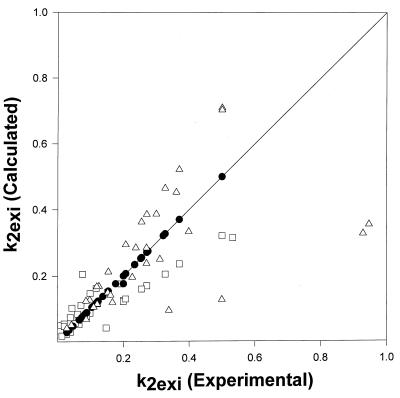
Figure 4.
Comparison of experimental and calculated individual proton exchange rates for 2.5 mM (□), 1 mM (●), and 0.5 mM (Δ) RNase S. The exchange rates at 2.5 mM and 0.5 mM are calculated from the experimentally measured 1 mM rates as described in the text. The solid line represents a line with slope equal to 1.

