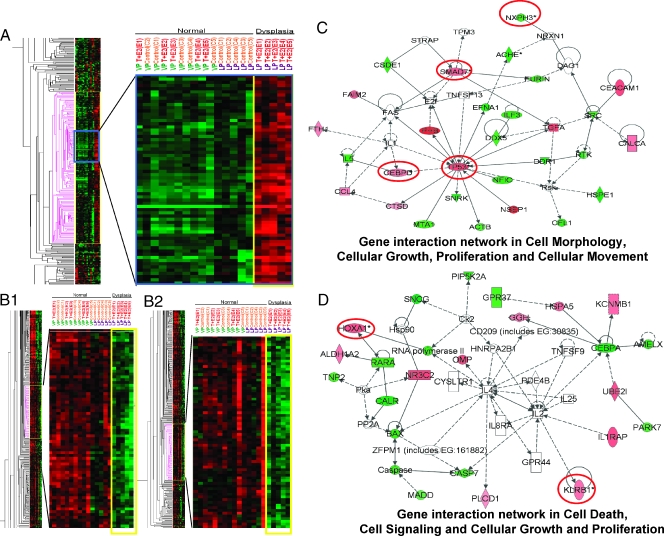
Figure 2.
Heat maps and gene interaction networks of differentially expressed genes found exclusively in the LP dysplasia following T + E2 treatment. Red and green denote upregulated and downregulated expression, respectively, as compared with the overall gene's mean value normalized to the universal rat reference RNA. Columns represent data from a single prostate sample, and rows correspond to a single gene probe. (A) A single cluster of upregulated genes identified in the T + E2 LP dysplasia, marked with pink (left panel); a selected region (blue box) of this cluster is enlarged (right panel). (B1 and B2) Two separate downregulated gene clusters observed only in T + E2 LP dysplasia, marked with pink (left panels); selected clusters are magnified (right panels). (C and D) Two representative gene interaction networks (with the highest relevancy scores) generated by IPA analysis from the differentially expressed genes in the T + E2 LP dysplasia panel. Green indicates downregulated; red, upregulated. Genes bordered in red were validated by real-time q-PCR. See Figure 1 for key to IPA network.

