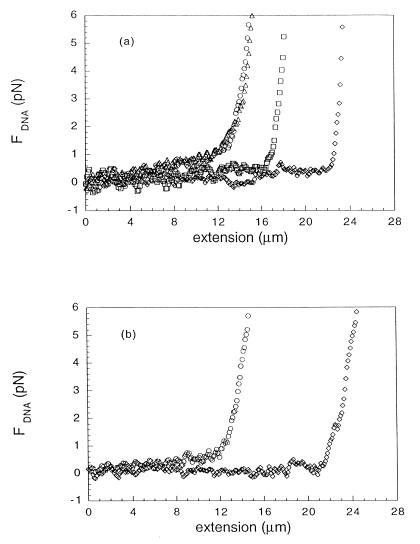
Figure 2.
The force exerted by DNA as a function of the extension at the various stages of RecA assembly. (a) ATP, (b) ATP[γS]. Curves for naked DNA (circles) and DNA fully covered with RecA (diamonds) are shown for both polymerization conditions. In a, the force-extension behavior for partially covered DNA at t2 = 15 min (squares) and the one obtained after depolymerization at t4 = 300 min (triangles) are also shown.

