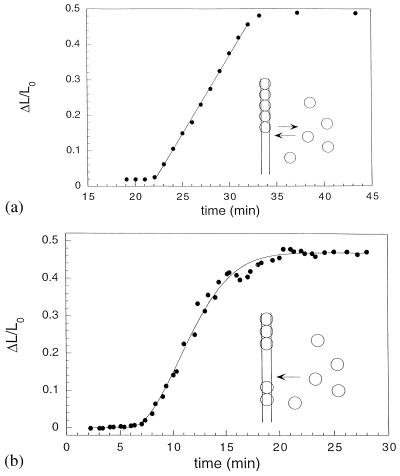
Figure 5.
Comparison of the relative change in the length of DNA during the assembly of RecA on DNA in the presence of (a) ATP (bullets) and (b) ATP[γS] (bullets). In a, the line corresponds to a linear fit to the growth phase of the ATP assembly. In b, the curve represents the best fit of Eq. 7 to the data. A schematic illustration of the corresponding mechanisms is shown in the insets of both a and b.

