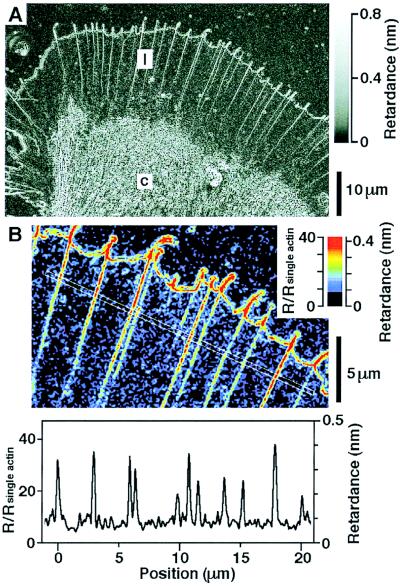
Figure 1.
Birefringent fine structure of the living Aplysia bag cell growth cone recorded with the Pol-Scope. (A) Retardance map of a growth cone. The leading edge (top) shows many finger-like protrusions, or filopodia. Behind the leading edge in the peripheral lamellar domain (or lamellipodium, l), birefringent fibers (bundles of actin filaments) are aligned radially. The central domain (c) is filled with vesicles and highly birefringent fibers (microtubules). Gray scale: Retardance in nm. (B) Birefringence of actin bundles measured as retardance and shown in pseudo color and as a profile plot. The pseudo color map shows the enlarged middle portion of the peripheral lamellar domain in A. The profile plot shows retardances measured in the white box in the map. Sharp peaks represent actin bundles. Maximum peak values are the retardances of the bundles. R/Rsingle is the retardance divided by that of a single actin filament, which estimates the number of actin filaments within a bundle (see Materials and Methods).

