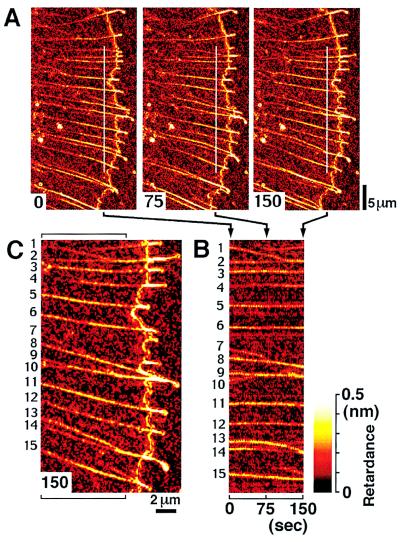
Figure 3.
Dynamics of actin bundle arrangement in the lamellipodium of a growth cone and assembly of a kymograph. (A) Individual retardance maps from a time-lapse movie of a wide growth cone. Numbers at bottom left of images show time in sec. The white lines indicate the long, narrow image strips near the leading edge that were used in assembling the kymograph in B. The strips had a width of 0.25 μm, which corresponds to the average distance traveled by retrograde flow between two consecutive movie frames (5-sec interval). (B) Kymograph assembled from image strips taken from 31 consecutive retardance maps. In the kymograph, the image strips are placed chronologically from 0 sec to 150 sec, in 5-sec intervals. Numbers on the left near the vertical image border identify corresponding actin bundles in C. (C) Magnified tip region of the lamellipodium at time 150 sec in A. The brackets on top and bottom indicate the approximate dimensions of B. Except for the convergence of the actin bundles toward the central domain of the lamellipodium (left side of C), the actin bundle arrangement in the kymograph in B is strikingly similar to those in the lamellipodium.

