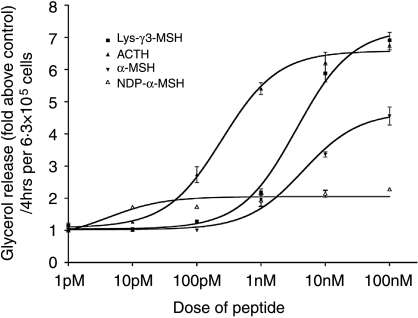
Figure 1.
Lys-γ3-MSH, ACTH, α-MSH and NDP-α-MSH are able to increase lipolysis in 3T3-L1 adipocytes. Results are presented as glycerol release (fold above control), per 4 h, per 6·3×105 cells. Each data point is the mean of the number of responses tested and the error bars represent mean±s.e.m. Curves were fitted using GraphPad Prism and used to calculate EC50 and BMax values for each peptide.

