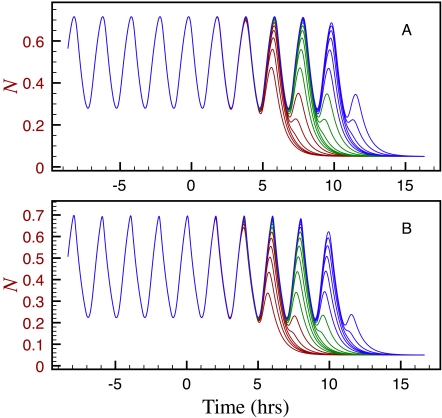
Figure 4. Plots of N vs. t representing the time-evolution of 18 cells distributed along the PSM, with a separation of 20 min between adjacent cells, with k evolving as in Figures 2C and 2D.
Under the assumption that the tail bud recedes at constant velocity and keeps leaving cells behind in a steady fashion, the distance between two PSM cells is proportional to the time difference elapsed since leaving the TB. The simulations plotted in A were carried using the model given by Equations (1) and (3). For the simulations plotted in B we employed the model given by Equations (4) and (5), which include additional delays associated to the interactions between the Notch and FGF/Wnt pathways. In both cases, the curves corresponding to cells closer to the TB stop oscillating latter. For more clarity, the curves corresponding to the first, second and third sets of six cells are plotted in red, green, and blue, respectively. All the parameters were set to the values estimated in the section on parameter estimation.

